
US unemployment statistics 2026
The US unemployment rate was 4.2% in September 2026, according to the Bureau of Labor Statistics. Below are 42 key statistics on US unemployment: the latest figures, yearly averages, records, the 2001, 2008-09 and 2020 downturns and the long-run trend, each calculated from the official monthly rate and linkable on its own.
Updated 1 November 2026. Source: U.S. Bureau of Labor Statistics, Current Population Survey. Monthly chart and full data: US unemployment rate tracker. Look up any month or year since 1948: US unemployment rate lookup. Download these figures: key figures (CSV) · by year (CSV).
Latest figures
- The US unemployment rate was 4.2% in September 2026, seasonally adjusted, according to the Bureau of Labor Statistics. #
- That is +0.1 percentage points from 4.1% in August 2026. #
- A year earlier, in September 2025, the rate was 4.4%, a change of −0.2 percentage points over twelve months. #
- Over the last twelve months the rate has ranged from 4.1% (July 2026) to 4.5% (November 2025). #
- The rate was last higher than 4.2% in May 2026, when it was 4.3%. #
- The rate has been below 5% in each of the last 60 reported months, since September 2021. #
Unemployment rate by year
- 2026 so far: the rate has averaged 4.2% across 9 months, against 4.3% in 2025, ranging from 4.1% (July 2026) to 4.4% (February 2026). #
- 2025: average 4.3%, +0.2 percentage points on 2024 (11 reported months). #
- 2024: average 4.0%, +0.4 percentage points on 2023. #
- 2023: average 3.6%, little changed (under 0.1 percentage points) on 2022. #
- 2022: average 3.7%, −1.7 percentage points on 2021. #
- 2021: average 5.4%, −2.8 percentage points on 2020. #
- 2020: average 8.1%, +4.4 percentage points on 2019. #
- 2019: average 3.7%, −0.2 percentage points on 2018. #
- 2018: average 3.9%, −0.5 percentage points on 2017. #
- 2017: average 4.4%, −0.5 percentage points on 2016. #
- 2016: average 4.9%, −0.4 percentage points on 2015. #
- 2015: average 5.3%, −0.9 percentage points on 2014. #
Records since 2000
- The highest rate since January 2000 was 14.8%, in April 2020. #
- The lowest was 3.4%, in April 2023. #
- The largest one-month rise was +10.4 percentage points, in April 2020. #
- The largest one-month fall was −2.2 percentage points, in June 2020. #
- The lowest complete-year average was 3.6% in 2023; the highest was 9.6% in 2010. #
- The rate was below 4% in 54 of the 320 reported months since January 2000. #
- It was 8% or higher in 49 months. #
Recessions and recoveries
- After the 2001 recession, the rate rose from 3.8% (April 2000) to a peak of 6.3% in June 2003. #
- In the 2008-09 financial crisis, it rose from 4.4% (October 2006) to 10.0% in October 2009, +5.6 percentage points in 36 months. #
- It took until September 2015, 71 months after that peak, to get back to 5% or below. #
- The pre-crisis low of 4.4% was not matched again until March 2017. #
- In the pandemic, the rate jumped from 3.5% in February 2020 to 14.8% in April 2020, the highest monthly rate since at least 2000. #
- Between March and April 2020 alone, it rose by 10.4 percentage points. #
- It returned to its February 2020 level of 3.5% or lower in July 2022, 27 months after the peak. #
- It fell back below 6% in May 2021. #
Long-run change
- The average rate since January 2000 is 5.6%. #
- From 2015 to 2019 it averaged 4.4%. #
- Since January 2022 it has averaged 3.9%. #
- The latest rate is +0.7 percentage points against February 2020 (3.5%), just before the pandemic. #
- It is +0.2 percentage points against January 2000 (4.0%). #
- The 2000s averaged 5.5%. #
- The 2010s averaged 6.2%. #
- There is no official rate for October 2025, when the household survey was not collected during the federal government shutdown; figures that need that month skip it. #
- The figures on this page draw on 320 monthly readings from January 2000 to September 2026. #
Download chart
A ready-to-use image of the average US unemployment rate in each year from 2010 to 2025, with the source credit printed on the chart. It is updated daily with this page.
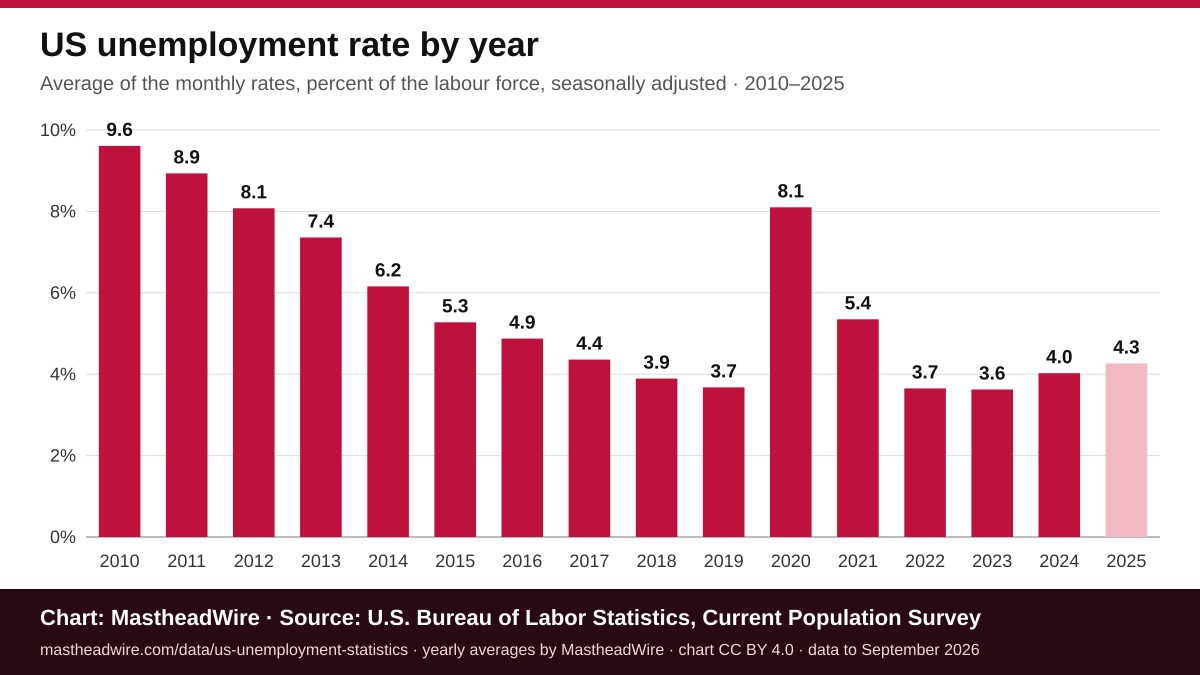
Download chart (PNG, 1200 × 675 px) · SVG version
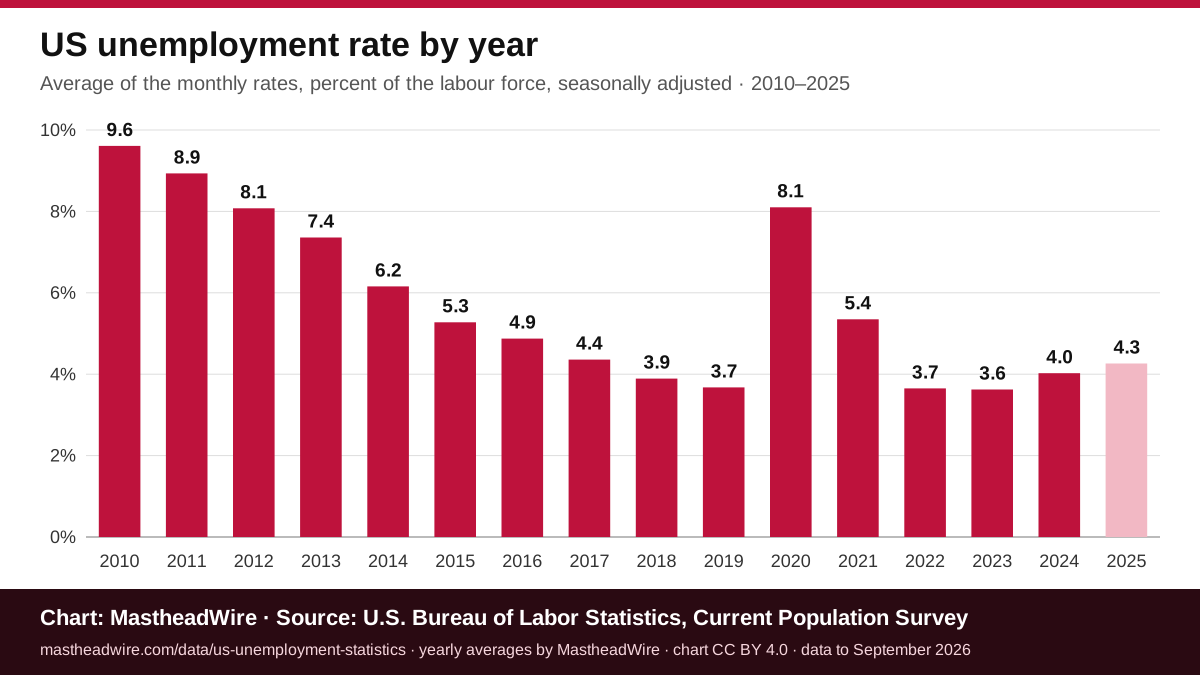
Each bar is the simple average of the seasonally adjusted monthly rates reported for that calendar year, calculated by MastheadWire from Bureau of Labor Statistics data (the same figures as the average column in the by-year CSV below). A lighter bar marks a year with fewer than 12 reported months (2025: 11 months), averaged over the months that were published. You may reuse the chart under a CC BY 4.0 licence with credit to MastheadWire and the U.S. Bureau of Labor Statistics, and a link to this page. Please keep the credit line on the image. To publish it, copy this code:
Download the data
The figures on this page are free to download as CSV files, built from the same Bureau of Labor Statistics data as the page and updated daily with it:
- US unemployment statistics key figures (CSV): all 42 statistics above, with the value, unit, period, full statement and a direct link to each figure.
- US unemployment rate by calendar year (CSV): the yearly average rate, change on the previous year in percentage points, the highest and lowest monthly rate of the year and the last reported month for 2000 to 2025 (26 years).
Every month since January 2000 is on the US unemployment rate tracker. You may reuse these files with credit to MastheadWire and the U.S. Bureau of Labor Statistics and a link to this page, under CC BY 4.0.
Cite this page
You are welcome to quote any statistic here with a link to this page. Each figure has its own link (the # after it) so you can point readers to the exact number, and a "Copy citation" button that copies the figure with its source and link.
Embed the latest unemployment rate
Copy this HTML to show the latest US unemployment rate on your own site or newsletter. It is plain HTML with no scripts. The figure is fixed when you copy it, so copy it again after a newer monthly release. Please keep the credit link.
How these figures are calculated
All figures use the seasonally adjusted monthly unemployment rate from the Current Population Survey, the household survey run by the Census Bureau for the Bureau of Labor Statistics and published in the monthly Employment Situation report, from January 2000 onward (series UNRATE, as distributed by the Federal Reserve Bank of St. Louis). The rate is the share of the labour force that is jobless, available for work and actively looking.
Yearly figures are the simple average of the monthly rates in each calendar year. Changes are in percentage points. Recovery dates are the first month after a peak when the rate was at or below the stated level. Averages, records and comparisons are calculated by MastheadWire. Seasonally adjusted rates for recent years are revised each January, and this page is refreshed after each monthly release.