
US nonfarm payrolls since 1939: jobs added by month and year
Nonfarm payrolls count the jobs on US employers' payrolls, the headline figure in the monthly jobs report. Look up any month since January 1939, compare any two months, and see the record gains and losses and the jobs added in every year. The latest figure is 159,293,000 jobs for October 2026, +165,000 on the month.
Updated 12 November 2026. Source: U.S. Bureau of Labor Statistics, Current Employment Statistics. The unemployment rate from the household survey: US unemployment rate tracker. Job openings, quits and layoffs: US job openings calculator.
In October 2026, US nonfarm payrolls stood at 159,293,000 jobs, seasonally adjusted. Employers added 165,000 jobs from September 2026 (+0.10%). That change ranks 508th of the 1,053 monthly changes since February 1939, from the largest gain to the largest loss. It was the 3rd gain in a row. Over 12 months, payrolls rose by 885,000 (+0.6%) from October 2025.
Key figures
- US employers added 165,000 jobs in October 2026, to 159,293,000. Over the last three months the change averaged +137,000 jobs a month. #
- In the 12 months to October 2026, payrolls grew by 885,000 jobs (+0.6%), an average of +74,000 a month, against +39,000 a month in the 12 months before. #
- The largest monthly gain on record was +4,631,000 jobs in June 2020; the largest loss was −20,469,000 jobs in April 2020. #
- The last month with fewer jobs than the month before was July 2026 (−10,000), 3 months before the latest figure. #
- The longest run of monthly gains lasted 113 months, from October 2010 to February 2020. The current run is 3 months long. #
- The most jobs added in a calendar year was +7,268,000 in 2021 (+5.1%); the most lost was −9,246,000 in 2020 (−6.1%). #
- Since February 2020, the month before the pandemic job losses, payrolls have grown by 7,000,000 jobs (+4.6%). #
Download chart
A ready-to-use line chart of monthly US nonfarm payrolls from January 1939 to October 2026, with the MastheadWire source credit printed on the image. It is refreshed with this page and currently shows data through October 2026. Values are in millions of jobs, seasonally adjusted.
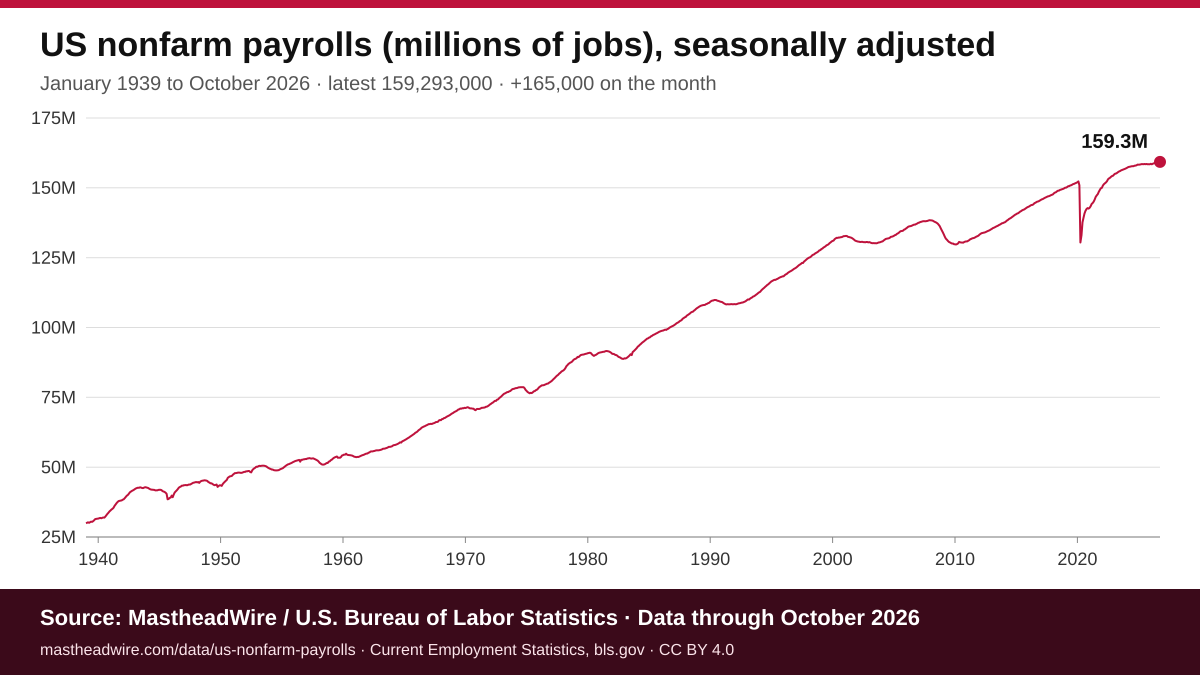
Download chart (PNG, 1200 × 675 px) · SVG version
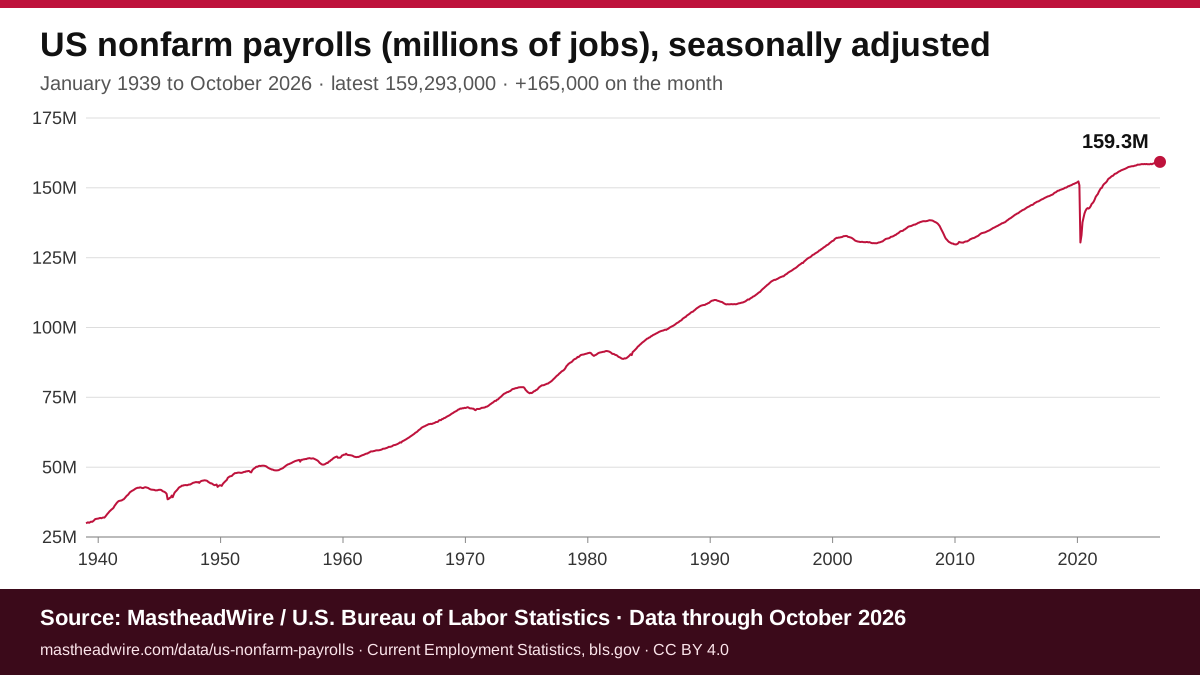
You may reuse the chart under a CC BY 4.0 licence with credit to MastheadWire and the U.S. Bureau of Labor Statistics, linking to this page. Please keep the credit line on the image. To publish it, copy this code:
Nonfarm payrolls for the last 24 months
Jobs on payrolls, the change on the month before, the three-month average change and the change on a year earlier. Each row has its own link, for example #month-2026-10.
| Month | Payrolls | Monthly change | Three-month average | Change on a year earlier | % |
|---|---|---|---|---|---|
| October 2026 | 159,293,000 | +165,000 | +137,000 | +885,000 | +0.6% |
| September 2026 | 159,128,000 | +60,000 | +79,000 | +580,000 | +0.4% |
| August 2026 | 159,068,000 | +186,000 | +69,000 | +596,000 | +0.4% |
| July 2026 | 158,882,000 | −10,000 | +28,000 | +340,000 | +0.2% |
| June 2026 | 158,892,000 | +31,000 | +81,000 | +414,000 | +0.3% |
| May 2026 | 158,861,000 | +63,000 | +142,000 | +363,000 | +0.2% |
| April 2026 | 158,798,000 | +148,000 | +69,000 | +313,000 | +0.2% |
| March 2026 | 158,650,000 | +214,000 | +73,000 | +273,000 | +0.2% |
| February 2026 | 158,436,000 | −156,000 | −4,000 | +126,000 | +0.1% |
| January 2026 | 158,592,000 | +160,000 | +61,000 | +324,000 | +0.2% |
| December 2025 | 158,432,000 | −17,000 | −39,000 | +116,000 | +0.1% |
| November 2025 | 158,449,000 | +41,000 | −8,000 | +370,000 | +0.2% |
| October 2025 | 158,408,000 | −140,000 | −45,000 | +463,000 | +0.3% |
| September 2025 | 158,548,000 | +76,000 | +23,000 | +636,000 | +0.4% |
| August 2025 | 158,472,000 | −70,000 | −9,000 | +715,000 | +0.5% |
| July 2025 | 158,542,000 | +64,000 | +19,000 | +794,000 | +0.5% |
| June 2025 | 158,478,000 | −20,000 | +34,000 | +783,000 | +0.5% |
| May 2025 | 158,498,000 | +13,000 | +63,000 | +890,000 | +0.6% |
| April 2025 | 158,485,000 | +108,000 | +72,000 | +955,000 | +0.6% |
| March 2025 | 158,377,000 | +67,000 | +20,000 | +911,000 | +0.6% |
| February 2025 | 158,310,000 | +42,000 | +77,000 | +1,072,000 | +0.7% |
| January 2025 | 158,268,000 | −48,000 | +108,000 | +1,236,000 | +0.8% |
| December 2024 | 158,316,000 | +237,000 | +135,000 | +1,459,000 | +0.9% |
| November 2024 | 158,079,000 | +134,000 | +107,000 | +1,376,000 | +0.9% |
Jobs added in every year since 1940
December to December, newest first; the latest year runs to October 2026: payrolls at the end of the year, jobs added, the percentage change, the average monthly change and the number of months with gains and losses. Each row has its own link, for example #year-2025.
| Year | Payrolls at end | Jobs added | % | Average a month | Months up / down |
|---|---|---|---|---|---|
| 2026 (to October) | 159,293,000 | +861,000 | +0.5% | +86,000 | 8 / 2 |
| 2025 | 158,432,000 | +116,000 | +0.1% | +10,000 | 7 / 5 |
| 2024 | 158,316,000 | +1,459,000 | +0.9% | +122,000 | 12 / 0 |
| 2023 | 156,857,000 | +2,515,000 | +1.6% | +210,000 | 12 / 0 |
| 2022 | 154,342,000 | +4,526,000 | +3.0% | +377,000 | 12 / 0 |
| 2021 | 149,816,000 | +7,268,000 | +5.1% | +606,000 | 12 / 0 |
| 2020 | 142,548,000 | −9,246,000 | −6.1% | −771,000 | 9 / 3 |
| 2019 | 151,794,000 | +1,985,000 | +1.3% | +165,000 | 12 / 0 |
| 2018 | 149,809,000 | +2,286,000 | +1.5% | +191,000 | 12 / 0 |
| 2017 | 147,523,000 | +2,115,000 | +1.5% | +176,000 | 12 / 0 |
| 2016 | 145,408,000 | +2,331,000 | +1.6% | +194,000 | 12 / 0 |
| 2015 | 143,077,000 | +2,713,000 | +1.9% | +226,000 | 12 / 0 |
| 2014 | 140,364,000 | +2,992,000 | +2.2% | +249,000 | 12 / 0 |
| 2013 | 137,372,000 | +2,298,000 | +1.7% | +192,000 | 12 / 0 |
| 2012 | 135,074,000 | +2,186,000 | +1.6% | +182,000 | 12 / 0 |
| 2011 | 132,888,000 | +2,058,000 | +1.6% | +172,000 | 12 / 0 |
| 2010 | 130,830,000 | +1,022,000 | +0.8% | +85,000 | 6 / 5 |
| 2009 | 129,808,000 | −5,039,000 | −3.7% | −420,000 | 0 / 12 |
| 2008 | 134,847,000 | −3,548,000 | −2.6% | −296,000 | 0 / 12 |
| 2007 | 138,395,000 | +1,146,000 | +0.8% | +96,000 | 10 / 2 |
| 2006 | 137,249,000 | +2,090,000 | +1.5% | +174,000 | 12 / 0 |
| 2005 | 135,159,000 | +2,529,000 | +1.9% | +211,000 | 12 / 0 |
| 2004 | 132,630,000 | +2,041,000 | +1.6% | +170,000 | 12 / 0 |
| 2003 | 130,589,000 | +124,000 | +0.1% | +10,000 | 6 / 6 |
| 2002 | 130,465,000 | −518,000 | −0.4% | −43,000 | 3 / 9 |
| 2001 | 130,983,000 | −1,733,000 | −1.3% | −144,000 | 1 / 11 |
| 2000 | 132,716,000 | +1,933,000 | +1.5% | +161,000 | 11 / 1 |
| 1999 | 130,783,000 | +3,188,000 | +2.5% | +266,000 | 12 / 0 |
| 1998 | 127,595,000 | +3,046,000 | +2.4% | +254,000 | 12 / 0 |
| 1997 | 124,549,000 | +3,406,000 | +2.8% | +284,000 | 11 / 1 |
| 1996 | 121,143,000 | +2,818,000 | +2.4% | +235,000 | 11 / 1 |
| 1995 | 118,325,000 | +2,151,000 | +1.9% | +179,000 | 11 / 1 |
| 1994 | 116,174,000 | +3,849,000 | +3.4% | +321,000 | 12 / 0 |
| 1993 | 112,325,000 | +2,823,000 | +2.6% | +235,000 | 11 / 1 |
| 1992 | 109,502,000 | +1,172,000 | +1.1% | +98,000 | 11 / 1 |
| 1991 | 108,330,000 | −838,000 | −0.8% | −70,000 | 5 / 7 |
| 1990 | 109,168,000 | +332,000 | +0.3% | +28,000 | 6 / 6 |
| 1989 | 108,836,000 | +1,938,000 | +1.8% | +162,000 | 12 / 0 |
| 1988 | 106,898,000 | +3,237,000 | +3.1% | +270,000 | 12 / 0 |
| 1987 | 103,661,000 | +3,152,000 | +3.1% | +263,000 | 12 / 0 |
| 1986 | 100,509,000 | +1,900,000 | +1.9% | +158,000 | 11 / 1 |
| 1985 | 98,609,000 | +2,502,000 | +2.6% | +209,000 | 12 / 0 |
| 1984 | 96,107,000 | +3,877,000 | +4.2% | +323,000 | 12 / 0 |
| 1983 | 92,230,000 | +3,459,000 | +3.9% | +288,000 | 10 / 2 |
| 1982 | 88,771,000 | −2,124,000 | −2.3% | −177,000 | 0 / 12 |
| 1981 | 90,895,000 | −48,000 | −0.1% | −4,000 | 7 / 5 |
| 1980 | 90,943,000 | +271,000 | +0.3% | +23,000 | 8 / 4 |
| 1979 | 90,672,000 | +2,001,000 | +2.3% | +167,000 | 11 / 1 |
| 1978 | 88,671,000 | +4,261,000 | +5.0% | +355,000 | 12 / 0 |
| 1977 | 84,410,000 | +3,962,000 | +4.9% | +330,000 | 12 / 0 |
| 1976 | 80,448,000 | +2,431,000 | +3.1% | +203,000 | 12 / 0 |
| 1975 | 78,017,000 | +365,000 | +0.5% | +30,000 | 7 / 5 |
| 1974 | 77,652,000 | −379,000 | −0.5% | −32,000 | 8 / 4 |
| 1973 | 78,031,000 | +2,763,000 | +3.7% | +230,000 | 12 / 0 |
| 1972 | 75,268,000 | +3,159,000 | +4.4% | +263,000 | 11 / 1 |
| 1971 | 72,109,000 | +1,317,000 | +1.9% | +110,000 | 11 / 1 |
| 1970 | 70,792,000 | −449,000 | −0.6% | −37,000 | 5 / 7 |
| 1969 | 71,241,000 | +1,993,000 | +2.9% | +166,000 | 10 / 2 |
| 1968 | 69,248,000 | +2,348,000 | +3.5% | +196,000 | 11 / 1 |
| 1967 | 66,900,000 | +1,701,000 | +2.6% | +142,000 | 11 / 1 |
| 1966 | 65,199,000 | +2,877,000 | +4.6% | +240,000 | 12 / 0 |
| 1965 | 62,322,000 | +2,901,000 | +4.9% | +242,000 | 12 / 0 |
| 1964 | 59,421,000 | +2,060,000 | +3.6% | +172,000 | 11 / 1 |
| 1963 | 57,361,000 | +1,333,000 | +2.4% | +111,000 | 11 / 1 |
| 1962 | 56,028,000 | +1,156,000 | +2.1% | +96,000 | 11 / 1 |
| 1961 | 54,872,000 | +1,130,000 | +2.1% | +94,000 | 9 / 3 |
| 1960 | 53,742,000 | −432,000 | −0.8% | −36,000 | 3 / 9 |
| 1959 | 54,174,000 | +2,089,000 | +4.0% | +174,000 | 10 / 2 |
| 1958 | 52,085,000 | −299,000 | −0.6% | −25,000 | 5 / 6 |
| 1957 | 52,384,000 | −545,000 | −1.0% | −45,000 | 5 / 7 |
| 1956 | 52,929,000 | +1,124,000 | +2.2% | +94,000 | 10 / 2 |
| 1955 | 51,805,000 | +2,474,000 | +5.0% | +206,000 | 12 / 0 |
| 1954 | 49,331,000 | −372,000 | −0.7% | −31,000 | 5 / 7 |
| 1953 | 49,703,000 | −463,000 | −0.9% | −39,000 | 5 / 7 |
| 1952 | 50,166,000 | +1,852,000 | +3.8% | +154,000 | 8 / 4 |
| 1951 | 48,314,000 | +1,453,000 | +3.1% | +121,000 | 8 / 4 |
| 1950 | 46,861,000 | +3,339,000 | +7.7% | +278,000 | 11 / 1 |
| 1949 | 43,522,000 | −1,510,000 | −3.4% | −126,000 | 4 / 8 |
| 1948 | 45,032,000 | +451,000 | +1.0% | +38,000 | 7 / 5 |
| 1947 | 44,581,000 | +1,202,000 | +2.8% | +100,000 | 10 / 2 |
| 1946 | 43,379,000 | +4,269,000 | +10.9% | +356,000 | 10 / 2 |
| 1945 | 39,110,000 | −2,750,000 | −6.6% | −229,000 | 5 / 7 |
| 1944 | 41,860,000 | −886,000 | −2.1% | −74,000 | 3 / 9 |
| 1943 | 42,746,000 | +831,000 | +2.0% | +69,000 | 7 / 5 |
| 1942 | 41,915,000 | +3,811,000 | +10.0% | +318,000 | 12 / 0 |
| 1941 | 38,104,000 | +3,930,000 | +11.5% | +328,000 | 12 / 0 |
| 1940 | 34,174,000 | +2,632,000 | +8.3% | +219,000 | 10 / 2 |
Examples
April 2020
In April 2020, US nonfarm payrolls stood at 130,426,000 jobs, seasonally adjusted. Payrolls fell by 20,469,000 jobs from March 2020 (−13.57%). That change ranks 1053rd of the 1,053 monthly changes since February 1939, from the largest gain to the largest loss. It was the 2nd loss in a row. Over 12 months, payrolls fell by 20,165,000 (−13.4%) from April 2019. The latest figure, for October 2026, is 159,293,000 jobs.
February 2020 to October 2026
From February 2020 to October 2026, US nonfarm payrolls rose by 7,000,000 (+4.6%), from 152,293,000 to 159,293,000 jobs. That is an average of +88,000 jobs a month over 80 months. Payrolls rose in 70 of those months and fell in 10. The best month was June 2020 (+4,631,000) and the worst was April 2020 (−20,469,000).
Download the data
- US nonfarm payrolls for every month since January 1939 (CSV): 1054 rows with payrolls and the change on the month and on a year earlier, in thousands.
- Jobs added in every year since 1940 (CSV): 87 rows with payrolls at the end of the year, jobs added, the percentage change, the average monthly change and months with gains and losses.
Free to reuse with credit to MastheadWire and the U.S. Bureau of Labor Statistics and a link to this page, under CC BY 4.0.
Cite or link to this calculator
Students, teachers, writers, analysts and researchers are welcome to use and link to this calculator. Each key figure and table row has its own link, such as #latest-month or #record-gain-loss.
To link to the latest figure from your own page or newsletter, copy this HTML. It is plain HTML with no scripts; please keep the credit link.
Frequently asked questions
How many jobs did US employers add in the latest month?
US employers added 165,000 jobs in October 2026, to 159,293,000. Over the last three months the change averaged +137,000 jobs a month.
How many jobs have been added over the past 12 months?
In the 12 months to October 2026, payrolls grew by 885,000 jobs (+0.6%), an average of +74,000 a month, against +39,000 a month in the 12 months before.
What are the record monthly payroll gains and losses?
The largest monthly gain on record was +4,631,000 jobs in June 2020; the largest loss was −20,469,000 jobs in April 2020.
When did US nonfarm payrolls last fall?
The last month with fewer jobs than the month before was July 2026 (−10,000), 3 months before the latest figure.
How do current payrolls compare with February 2020?
Since February 2020, the month before the pandemic job losses, payrolls have grown by 7,000,000 jobs (+4.6%).
Where does this data come from and how often is it updated?
From the U.S. Bureau of Labor Statistics Current Employment Statistics survey of employers (total nonfarm employment, seasonally adjusted), as published on FRED series PAYEMS. This page is updated daily.
How to cite this
APA style:
Methods
Figures are total nonfarm employment, seasonally adjusted, in thousands of jobs, from the Bureau of Labor Statistics Current Employment Statistics survey of employers (BLS series CES0000000001), as published on FRED (series PAYEMS) from January 1939. The survey counts jobs, not people: someone with two jobs is counted twice, and farm workers, the self-employed and household workers are not included. The unemployment rate comes from a different survey, of households.
Monthly changes are the difference between one month's payrolls and the month before; the three-month average and yearly figures use the same published levels, so they can differ slightly from the rounded changes in the jobs report. The figures use today's revised data: BLS revises the two previous months with each new report and benchmarks the whole series each February, so figures can differ from those reported at the time. Percentages are rounded half away from zero. This page is updated daily.
Primary source: Current Employment Statistics, U.S. Bureau of Labor Statistics (FRED series PAYEMS). This page is updated daily (last updated 12 November 2026).