
US job openings since 2000: JOLTS openings, quits, hires and layoffs
The Job Openings and Labor Turnover Survey (JOLTS) counts how many jobs US employers are trying to fill, and how many people were hired, quit or were laid off each month. Look up any month since December 2000, compare any two months, and see job openings per unemployed person, the records and the average for every year. The latest figure is 7,523,000 job openings for September 2026, a rate of 4.5%.
Updated 12 November 2026. Source: U.S. Bureau of Labor Statistics, Job Openings and Labor Turnover Survey. Jobs on payrolls: US nonfarm payrolls calculator. The unemployment rate: US unemployment rate tracker.
In September 2026, US employers had 7,523,000 job openings, a job openings rate of 4.5%, seasonally adjusted. That was up 333,000 from August 2026 and up 354,000 from a year earlier. With 7,109,000 people unemployed, there were 1.06 job openings for every unemployed person. Hires were 5,402,000 (3.4%), quits 3,365,000 (2.1%) and layoffs and discharges 1,641,000 (1.0%). The openings level ranks 45th highest of the 310 months since December 2000, and the quits rate ranks 102nd highest.
Key figures
- US employers had 7,523,000 job openings in September 2026 (rate 4.5%), up 333,000 from August 2026 and up 354,000 from a year earlier. #
- In September 2026 there were 1.06 job openings for every unemployed person (7,523,000 openings, 7,109,000 unemployed). Openings outnumbered unemployed people in 79 of the 309 months with both figures; the last month with fewer openings than unemployed people was March 2026. #
- The most job openings on record were 12,301,000 in March 2022 (rate 7.5%); the fewest were 2,232,000 in July 2009 (rate 1.7%). #
- The highest number of openings per unemployed person was 2.04 in March 2022; the lowest was 0.15 in July 2009. #
- The quits rate, the share of workers leaving their jobs by choice, was 2.1% in September 2026. Its highest on record was 3.0% in November 2021 (4,453,000 quits) and its lowest 1.2% in August 2009. The highest full-year average was 2.8% in 2022. #
- The most layoffs and discharges in one month were 12,985,000 in March 2020 (rate 8.6%). In September 2026 there were 1,641,000 (1.0%). #
- Since February 2020, the month before the pandemic, job openings have gone from 6,966,000 to 7,523,000 (+557,000), and the quits rate from 2.3% to 2.1%. #
Download chart
A ready-to-use line chart of monthly US job openings (JOLTS total nonfarm, seasonally adjusted) from December 2000 to September 2026, with the MastheadWire source credit printed on the image. It is refreshed with this page and currently shows data through September 2026. Values are job openings levels in millions (seasonally adjusted).
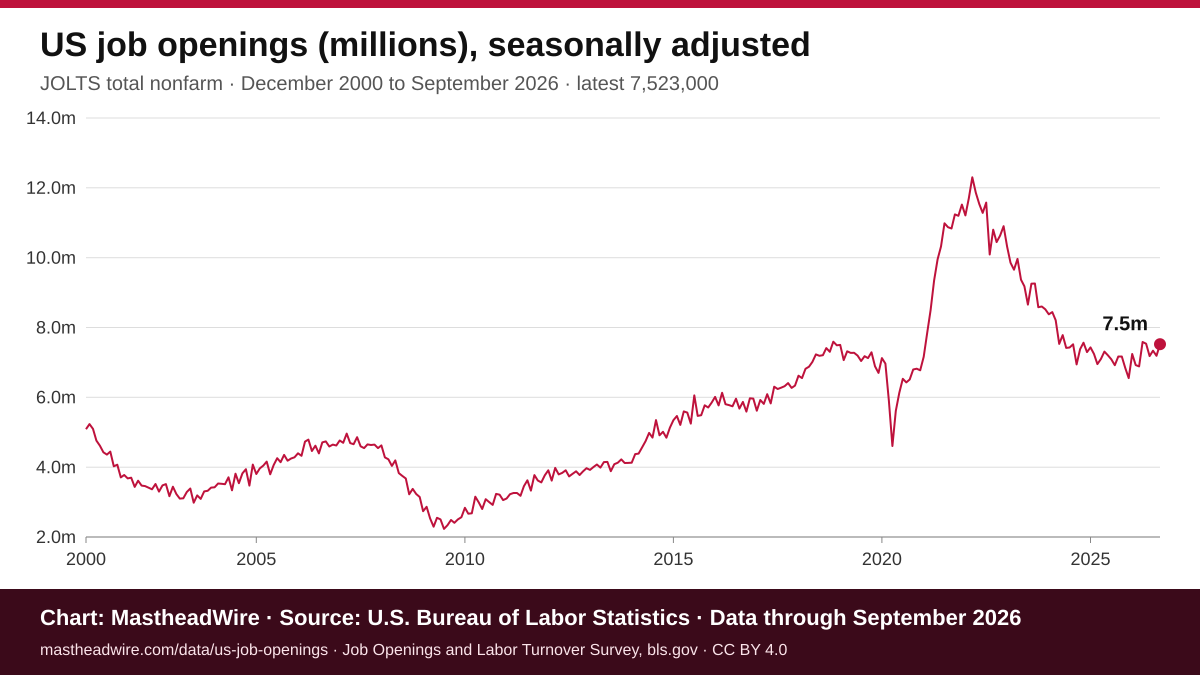
Download chart (PNG, 1200 × 675 px) · SVG version
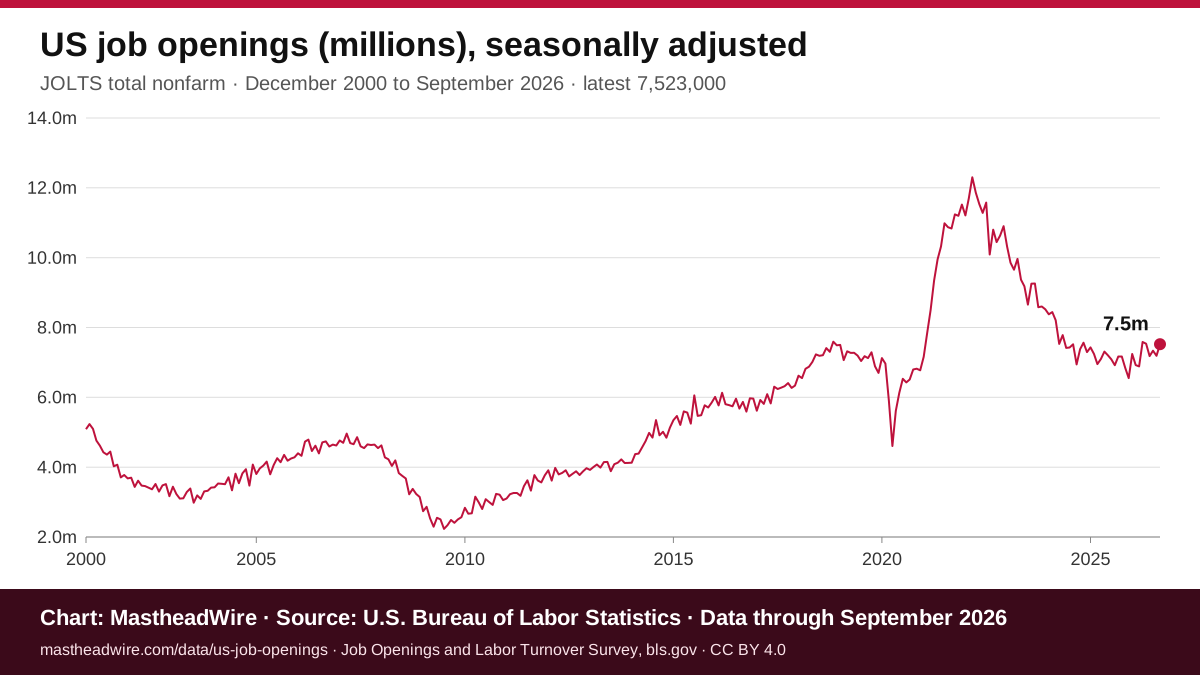
You may reuse the chart under a CC BY 4.0 licence with credit to MastheadWire and the U.S. Bureau of Labor Statistics, linking to this page. Please keep the credit line on the image. To publish it, copy this code:
Job openings, hires, quits and layoffs for the last 24 months
Job openings and the openings rate, openings per unemployed person, hires, quits and the quits rate, and layoffs and discharges. Each row has its own link, for example #month-2026-09.
| Month | Job openings | Rate | Per unemployed person | Hires | Quits | Quits rate | Layoffs and discharges |
|---|---|---|---|---|---|---|---|
| September 2026 | 7,523,000 | 4.5% | 1.06 | 5,402,000 | 3,365,000 | 2.1% | 1,641,000 |
| August 2026 | 7,190,000 | 4.3% | 1.02 | 5,271,000 | 3,044,000 | 1.9% | 1,768,000 |
| July 2026 | 7,335,000 | 4.4% | 1.06 | 5,146,000 | 3,089,000 | 1.9% | 1,702,000 |
| June 2026 | 7,182,000 | 4.3% | 1.01 | 5,332,000 | 3,213,000 | 2.0% | 1,785,000 |
| May 2026 | 7,537,000 | 4.5% | 1.03 | 5,252,000 | 3,153,000 | 2.0% | 1,761,000 |
| April 2026 | 7,585,000 | 4.6% | 1.03 | 5,215,000 | 3,043,000 | 1.9% | 1,667,000 |
| March 2026 | 6,887,000 | 4.2% | 0.95 | 5,535,000 | 3,160,000 | 2.0% | 1,884,000 |
| February 2026 | 6,922,000 | 4.2% | 0.91 | 4,899,000 | 3,046,000 | 1.9% | 1,714,000 |
| January 2026 | 7,240,000 | 4.4% | 0.98 | 5,347,000 | 3,131,000 | 2.0% | 1,660,000 |
| December 2025 | 6,550,000 | 4.0% | 0.87 | 5,272,000 | 3,225,000 | 2.0% | 1,666,000 |
| November 2025 | 6,846,000 | 4.1% | 0.88 | 5,019,000 | 3,119,000 | 2.0% | 1,660,000 |
| October 2025 | 7,170,000 | 4.3% | n/a | 5,180,000 | 2,980,000 | 1.9% | 1,891,000 |
| September 2025 | 7,169,000 | 4.3% | 0.94 | 5,244,000 | 2,990,000 | 1.9% | 1,816,000 |
| August 2025 | 6,919,000 | 4.2% | 0.94 | 5,145,000 | 3,095,000 | 2.0% | 1,832,000 |
| July 2025 | 7,089,000 | 4.3% | 0.97 | 5,225,000 | 3,132,000 | 2.0% | 1,772,000 |
| June 2025 | 7,204,000 | 4.3% | 1.02 | 5,327,000 | 3,254,000 | 2.1% | 1,843,000 |
| May 2025 | 7,310,000 | 4.4% | 1.01 | 5,328,000 | 3,287,000 | 2.1% | 1,671,000 |
| April 2025 | 7,098,000 | 4.3% | 0.99 | 5,391,000 | 3,144,000 | 2.0% | 1,818,000 |
| March 2025 | 6,952,000 | 4.2% | 0.97 | 5,333,000 | 3,456,000 | 2.2% | 1,595,000 |
| February 2025 | 7,242,000 | 4.4% | 1.02 | 5,236,000 | 3,153,000 | 2.0% | 1,867,000 |
| January 2025 | 7,431,000 | 4.5% | 1.08 | 5,238,000 | 3,203,000 | 2.0% | 1,738,000 |
| December 2024 | 7,295,000 | 4.4% | 1.05 | 5,292,000 | 3,085,000 | 1.9% | 1,689,000 |
| November 2024 | 7,566,000 | 4.6% | 1.07 | 5,155,000 | 3,050,000 | 1.9% | 1,831,000 |
| October 2024 | 7,379,000 | 4.5% | 1.06 | 5,228,000 | 3,215,000 | 2.0% | 1,650,000 |
Average job openings, quits and layoffs in every year since 2001
Averages of the monthly figures and rates for each calendar year, newest first; the latest year runs to September 2026. Openings per unemployed person is total openings divided by total unemployed people over the year's months. Each row has its own link, for example #year-2025.
| Year | Job openings | Rate | Per unemployed person | Hires | Quits | Quits rate | Layoffs and discharges |
|---|---|---|---|---|---|---|---|
| 2026 (to September) | 7,267,000 | 4.4% | 1.01 | 5,267,000 | 3,138,000 | 2.0% | 1,731,000 |
| 2025 | 7,082,000 | 4.3% | 0.97 | 5,245,000 | 3,170,000 | 2.0% | 1,764,000 |
| 2024 | 7,657,000 | 4.7% | 1.13 | 5,375,000 | 3,275,000 | 2.1% | 1,676,000 |
| 2023 | 9,268,000 | 5.6% | 1.53 | 5,865,000 | 3,687,000 | 2.4% | 1,650,000 |
| 2022 | 11,195,000 | 6.9% | 1.87 | 6,411,000 | 4,215,000 | 2.8% | 1,468,000 |
| 2021 | 9,979,000 | 6.4% | 1.16 | 6,354,000 | 3,967,000 | 2.7% | 1,417,000 |
| 2020 | 6,349,000 | 4.3% | 0.49 | 6,053,000 | 2,989,000 | 2.1% | 3,413,000 |
| 2019 | 7,154,000 | 4.5% | 1.19 | 5,833,000 | 3,513,000 | 2.3% | 1,818,000 |
| 2018 | 7,109,000 | 4.6% | 1.13 | 5,713,000 | 3,360,000 | 2.3% | 1,815,000 |
| 2017 | 6,119,000 | 4.0% | 0.88 | 5,466,000 | 3,145,000 | 2.2% | 1,798,000 |
| 2016 | 5,856,000 | 3.9% | 0.76 | 5,312,000 | 2,989,000 | 2.1% | 1,769,000 |
| 2015 | 5,564,000 | 3.8% | 0.67 | 5,218,000 | 2,804,000 | 2.0% | 1,815,000 |
| 2014 | 4,773,000 | 3.3% | 0.50 | 4,912,000 | 2,535,000 | 1.8% | 1,761,000 |
| 2013 | 4,071,000 | 2.9% | 0.36 | 4,573,000 | 2,289,000 | 1.7% | 1,751,000 |
| 2012 | 3,841,000 | 2.8% | 0.31 | 4,447,000 | 2,084,000 | 1.5% | 1,847,000 |
| 2011 | 3,430,000 | 2.6% | 0.25 | 4,305,000 | 1,972,000 | 1.5% | 1,840,000 |
| 2010 | 2,969,000 | 2.2% | 0.20 | 4,138,000 | 1,858,000 | 1.4% | 1,879,000 |
| 2009 | 2,501,000 | 1.9% | 0.17 | 3,898,000 | 1,745,000 | 1.3% | 2,288,000 |
| 2008 | 3,799,000 | 2.7% | 0.42 | 4,702,000 | 2,535,000 | 1.9% | 2,113,000 |
| 2007 | 4,688,000 | 3.3% | 0.66 | 5,314,000 | 2,905,000 | 2.1% | 1,955,000 |
| 2006 | 4,585,000 | 3.3% | 0.66 | 5,396,000 | 2,975,000 | 2.2% | 1,856,000 |
| 2005 | 4,108,000 | 3.0% | 0.54 | 5,313,000 | 2,811,000 | 2.1% | 1,971,000 |
| 2004 | 3,642,000 | 2.7% | 0.45 | 5,042,000 | 2,564,000 | 1.9% | 1,973,000 |
| 2003 | 3,238,000 | 2.4% | 0.37 | 4,747,000 | 2,357,000 | 1.8% | 2,025,000 |
| 2002 | 3,453,000 | 2.6% | 0.41 | 4,850,000 | 2,547,000 | 2.0% | 1,970,000 |
| 2001 | 4,350,000 | 3.2% | 0.64 | 5,210,000 | 2,907,000 | 2.2% | 2,066,000 |
Examples
March 2022
In March 2022, US employers had 12,301,000 job openings, a job openings rate of 7.5%, seasonally adjusted. That was up 603,000 from February 2022 and up 3,802,000 from a year earlier. With 6,033,000 people unemployed, there were 2.04 job openings for every unemployed person. Hires were 6,619,000 (4.4%), quits 4,447,000 (2.9%) and layoffs and discharges 1,377,000 (0.9%). The openings level ranks 1st highest of the 310 months since December 2000, and the quits rate ranks 3rd highest. The latest figure, for September 2026, is 7,523,000 job openings.
February 2020 to September 2026
From February 2020 to September 2026, US job openings went from 6,966,000 to 7,523,000 (up 557,000), and the job openings rate from 4.4% to 4.5%. Over those 80 months, openings averaged 8,458,000 a month, hires 5,813,000, quits 3,504,000 and layoffs and discharges 1,880,000. The most openings were in March 2022 (12,301,000) and the fewest in April 2020 (4,606,000). The quits rate moved from 2.3% to 2.1%.
Download the data
- US job openings, hires, quits and layoffs for every month since December 2000 (CSV): 310 rows with levels in thousands, rates, unemployed people and openings per unemployed person.
- Yearly averages since 2001 (CSV): 26 rows with average openings, openings rate, hires, quits, quits rate, layoffs and openings per unemployed person.
Free to reuse with credit to MastheadWire and the U.S. Bureau of Labor Statistics and a link to this page, under CC BY 4.0.
Cite or link to this calculator
Students, teachers, writers, analysts and researchers are welcome to use and link to this calculator. Each key figure and table row has its own link, such as #latest-month or #openings-per-unemployed.
To link to the latest figure from your own page or newsletter, copy this HTML. It is plain HTML with no scripts; please keep the credit link.
Frequently asked questions
How many US job openings were there in the latest month?
US employers had 7,523,000 job openings in September 2026 (rate 4.5%), up 333,000 from August 2026 and up 354,000 from a year earlier.
How many job openings are there per unemployed person?
In September 2026 there were 1.06 job openings for every unemployed person (7,523,000 openings, 7,109,000 unemployed). Openings outnumbered unemployed people in 79 of the 309 months with both figures; the last month with fewer openings than unemployed people was March 2026.
What is the record high for US job openings?
The most job openings on record were 12,301,000 in March 2022 (rate 7.5%); the fewest were 2,232,000 in July 2009 (rate 1.7%).
What is the latest quits rate?
The quits rate, the share of workers leaving their jobs by choice, was 2.1% in September 2026. Its highest on record was 3.0% in November 2021 (4,453,000 quits) and its lowest 1.2% in August 2009. The highest full-year average was 2.8% in 2022.
How do job openings compare with February 2020?
Since February 2020, the month before the pandemic, job openings have gone from 6,966,000 to 7,523,000 (+557,000), and the quits rate from 2.3% to 2.1%.
Where does this data come from and how often is it updated?
From the U.S. Bureau of Labor Statistics Job Openings and Labor Turnover Survey (JOLTS), as published on FRED (series JTSJOL, JTSHIL, JTSQUL, JTSLDL and matching rates). This page is updated daily.
How to cite this
APA style:
Methods and sources
Figures are total nonfarm job openings, hires, quits and layoffs and discharges, seasonally adjusted, in thousands, and their rates, from the Bureau of Labor Statistics Job Openings and Labor Turnover Survey, as published on FRED (series JTSJOL, JTSHIL, JTSQUL, JTSLDL and the matching rates) from December 2000, when the survey began. A job opening is a position that is open on the last business day of the month and that the employer is actively trying to fill. The openings rate is openings divided by employment plus openings; the other rates are divided by employment.
Openings per unemployed person divides job openings by the number of unemployed people from the Current Population Survey (FRED series UNEMPLOY), rounded to two decimals. The number of unemployed people was not published for October 2025, during the federal government shutdown, so that month has no ratio and is left out of the yearly ratio. The figures use today's revised data, so they can differ from those first reported. This page is updated daily.
Primary source: Job Openings and Labor Turnover Survey, U.S. Bureau of Labor Statistics. This page is updated daily (last updated 12 November 2026).