
US employers added 165,000 jobs in October 2026; unemployment rate 4.1%
US employers added 165,000 jobs in October 2026, the Bureau of Labor Statistics said in its Employment Situation report on November 6, 2026. The unemployment rate was 4.1%, down from 4.2%. Revisions raised payroll gains for August and September by a combined 84,000.
Key figures
- Total nonfarm payrolls were 159.29 million in October 2026, a change of +165,000 on the month. #
- Payroll gains averaged +137,000 a month over the latest three months, compared with +48,000 a month in the 12 months before October 2026. #
- The unemployment rate was 4.1%, down from 4.2%. #
- Average hourly earnings of private-sector employees were $38.00, up 0.4% on the month and up 3.1% on a year earlier. #
- Revisions raised payroll gains for August and September by a combined 84,000: August 2026 to +186,000 from +133,000, and September 2026 to +60,000 from +29,000. #
Monthly payroll change, last 24 months
Download chart
A ready-to-use bar chart of the monthly change in US nonfarm payrolls from November 2024 to October 2026, with the MastheadWire source credit printed on the image. It is refreshed with this page and currently shows data through October 2026. The latest month is highlighted.
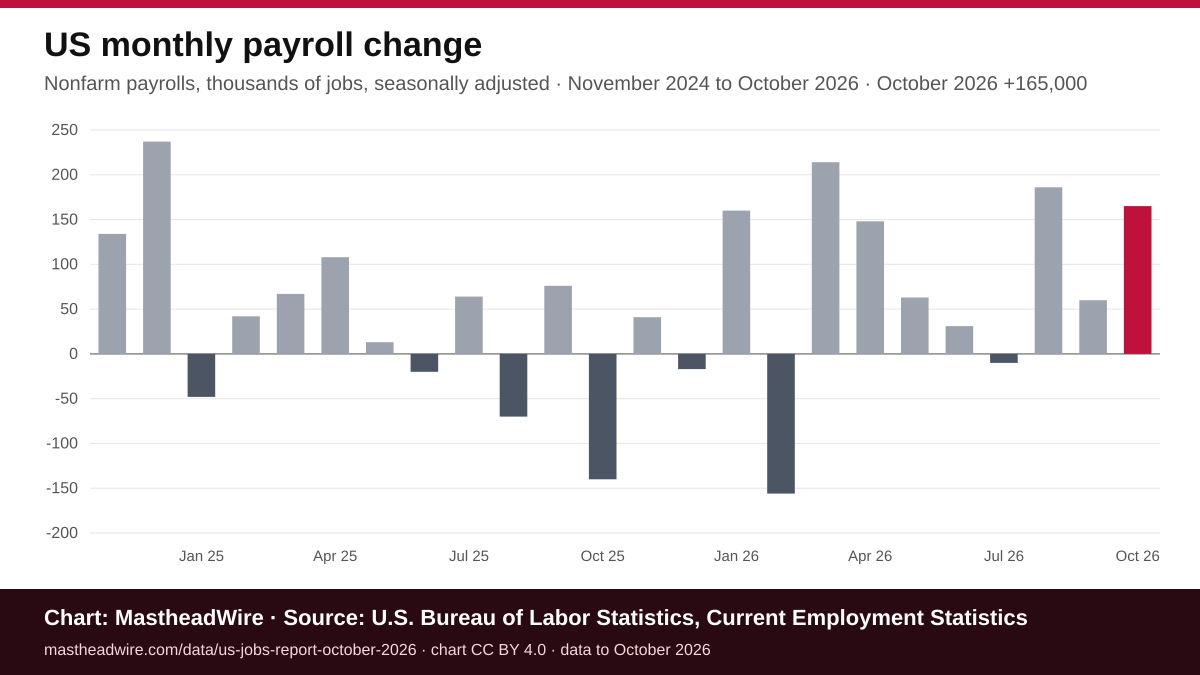
Download chart (PNG, 1200 × 675 px) · SVG version
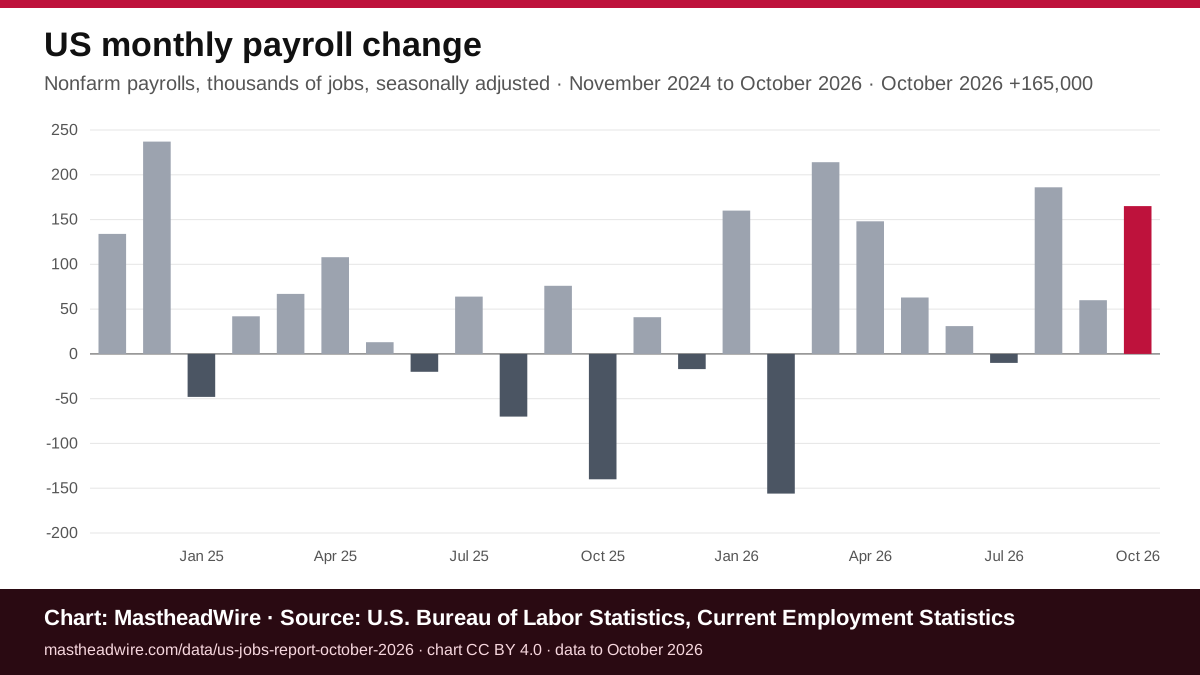
You may reuse the chart under a CC BY 4.0 licence with credit to MastheadWire and the U.S. Bureau of Labor Statistics, linking to this page. Please keep the credit line on the image. To publish it, copy this code:
The last 24 months
| Month | Payrolls (thousands) | Monthly change | Unemployment rate | Average hourly earnings | Earnings, year on year |
|---|---|---|---|---|---|
| October 2026 | 159,293 | +165,000 | 4.1% | $38.00 | 3.1% |
| September 2026 | 159,128 | +60,000 | 4.2% | $37.86 | 3.2% |
| August 2026 | 159,068 | +186,000 | 4.1% | $37.76 | 3.1% |
| July 2026 | 158,882 | -10,000 | 4.1% | $37.64 | 3.2% |
| June 2026 | 158,892 | +31,000 | 4.2% | $37.59 | 3.4% |
| May 2026 | 158,861 | +63,000 | 4.3% | $37.49 | 3.3% |
| April 2026 | 158,798 | +148,000 | 4.3% | $37.41 | 3.6% |
| March 2026 | 158,650 | +214,000 | 4.3% | $37.35 | 3.4% |
| February 2026 | 158,436 | -156,000 | 4.4% | $37.27 | 3.7% |
| January 2026 | 158,592 | +160,000 | 4.3% | $37.15 | 3.7% |
| December 2025 | 158,432 | -17,000 | 4.4% | $37.02 | 3.7% |
| November 2025 | 158,449 | +41,000 | 4.5% | $37.00 | 3.9% |
| October 2025 | 158,408 | -140,000 | n/a | $36.85 | 3.9% |
| September 2025 | 158,548 | +76,000 | 4.4% | $36.70 | 3.8% |
| August 2025 | 158,472 | -70,000 | 4.3% | $36.62 | 4.0% |
| July 2025 | 158,542 | +64,000 | 4.3% | $36.47 | 4.0% |
| June 2025 | 158,478 | -20,000 | 4.1% | $36.36 | 3.9% |
| May 2025 | 158,498 | +13,000 | 4.3% | $36.28 | 4.0% |
| April 2025 | 158,485 | +108,000 | 4.2% | $36.12 | 3.9% |
| March 2025 | 158,377 | +67,000 | 4.2% | $36.11 | 4.2% |
| February 2025 | 158,310 | +42,000 | 4.2% | $35.94 | 4.1% |
| January 2025 | 158,268 | -48,000 | 4.0% | $35.84 | 4.0% |
| December 2024 | 158,316 | +237,000 | 4.1% | $35.69 | n/a |
| November 2024 | 158,079 | +134,000 | 4.2% | $35.60 | n/a |
Download the data
US jobs report data, November 2024 to October 2026 (CSV): 24 rows with payrolls, the monthly change, the unemployment rate and average hourly earnings. Free to reuse with credit to MastheadWire and the U.S. Bureau of Labor Statistics and a link to this page, under the CC BY 4.0 licence. The full series are in the nonfarm payrolls calculator, the unemployment rate tracker and the labor force participation rate page.
Frequently asked questions
How many jobs did US employers add or cut in October 2026?
Total nonfarm payrolls changed by +165,000 in October 2026, leaving payrolls at 159.29 million.
What was the US unemployment rate in October 2026?
The unemployment rate was 4.1%, down from 4.2%.
How fast were wages rising in October 2026?
Average hourly earnings of private-sector employees were $38.00, up 0.4% on the month and up 3.1% on a year earlier.
What did revisions do to the prior two months?
Revisions raised payroll gains for August and September by a combined 84,000: August 2026 to +186,000 from +133,000, and September 2026 to +60,000 from +29,000.
Where does this US jobs report data come from?
Payrolls are BLS series CES0000000001, the unemployment rate is LNS14000000, and earnings are CES0500000003, all seasonally adjusted. Figures on this page were checked against the BLS public database.
How to cite this
APA style:
Plain-text citation:
To link to the headline figures from your own page or newsletter, copy this HTML:
Methods
Payrolls are total nonfarm employment from the BLS Current Employment Statistics survey of employers (series CES0000000001); the unemployment rate comes from the Current Population Survey of households (LNS14000000); earnings are average hourly earnings of all private employees (CES0500000003). All are seasonally adjusted. Revisions compare the monthly changes in this release with those published before it. Figures were checked against the BLS database. Monthly changes are computed from published levels, so they can differ by rounding from the jobs report text. BLS revises the two previous months each release and benchmarks payrolls each February. The tables on this site are updated daily. More data: MastheadWire jobs and unemployment data.
Primary source: Current Employment Statistics and the Current Population Survey, U.S. Bureau of Labor Statistics. This page is updated daily (last updated November 6, 2026).